This notebook uses earthkit-plots to make visualizations of temperature data stored in a NetCDF file. While other notebooks have used xarray or geopandas for rapid, exploratory plots, here we use earthkit-plots for greater control over map design and access to additional convenience functionality.
import earthkit
import xarray as xr
We have downloaded a NetCDF file from the “ERA5-Land monthly averaged data from 1950 to present” dataset on the Climate Data Store. The file contains a ~9 km resolution grid of mean air temperature for February 2025, covering the entire globe, and can be opened as an xarray dataset:
file = "../data/era5-land-monthly-temp-feb-2025-global.nc"
temperature = xr.open_dataset(file)
The quickest way to get started with earthkit-plots is with the quickplot function, which will take your data and attempt to generate something appropriate:
earthkit.plots.quickplot(temperature)<earthkit.plots.components.figures.Figure at 0x15a96807770>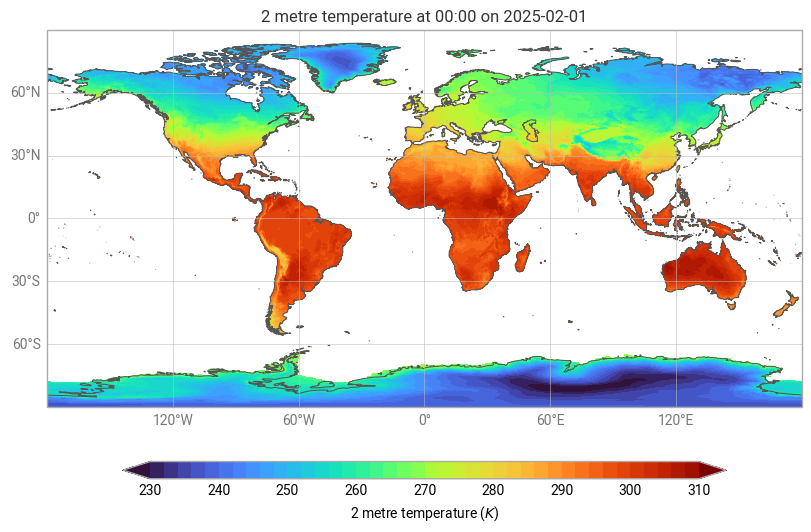
We see a global map with temperatures in kelvin. If we want to switch to Celcius and focus on Africa we can add some parameters:
earthkit.plots.quickplot(temperature, units="celsius", domain="Africa")<earthkit.plots.components.figures.Figure at 0x20fa770d590>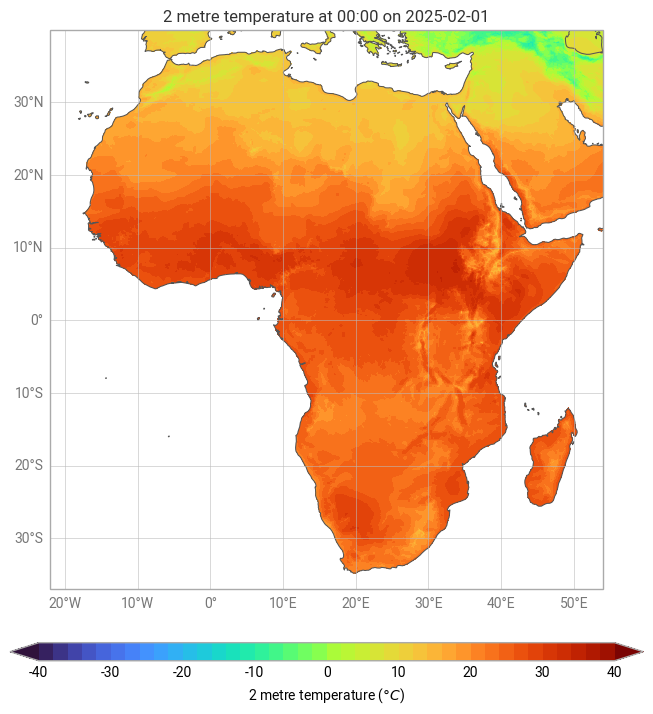
The Map class gives you more control and provides various methods for plotting and enhancing visualisations. Below is an example of how to create a map, add title and legend, and overlay coastlines, borders and cities.
map = earthkit.plots.Map(domain="Ethiopia")
map.quickplot(temperature, units="celsius")
map.legend(label="{variable_name} ({units})")
map.title("ERA5-Land mean {variable_name} in {time:%B %Y}")
map.coastlines()
map.borders()
map.cities()
map.show()
c:\Users\karimba\AppData\Local\miniconda3\envs\climate-tools-new\Lib\site-packages\cartopy\io\__init__.py:242: DownloadWarning: Downloading: https://naturalearth.s3.amazonaws.com/110m_cultural/ne_110m_admin_0_map_units.zip
warnings.warn(f'Downloading: {url}', DownloadWarning)
c:\Users\karimba\AppData\Local\miniconda3\envs\climate-tools-new\Lib\site-packages\cartopy\io\__init__.py:242: DownloadWarning: Downloading: https://naturalearth.s3.amazonaws.com/50m_cultural/ne_50m_admin_0_boundary_lines_land.zip
warnings.warn(f'Downloading: {url}', DownloadWarning)
c:\Users\karimba\AppData\Local\miniconda3\envs\climate-tools-new\Lib\site-packages\cartopy\io\__init__.py:242: DownloadWarning: Downloading: https://naturalearth.s3.amazonaws.com/50m_cultural/ne_50m_populated_places.zip
warnings.warn(f'Downloading: {url}', DownloadWarning)

Se more examples in the earthkit-plot gallery.
How to visualize data with earthkit